Every explainer on carbon removal technology gives you the same menu. Direct air capture, bioenergy with carbon capture and storage, biochar, enhanced weathering, trees. Each one gets a mechanism, a benefits list and a limitations list, all weighted as though they were live options competing on equal terms.
They are not. One of these pathways supplied most of the durable tonnes that were actually verified and retired last year. Another holds three quarters of the contracts and has delivered a fraction of them. That distinction decides whether a project is an asset or a promise, and it is missing from almost every page ranking for this query.
Start with the definition, because it is where the confusion begins. Carbon removal takes CO2 that is already in the atmosphere. Carbon capture and storage takes CO2 at the smokestack before it gets there, which makes it a form of emissions reduction rather than carbon removal. Humanity has emitted more than 2,000 gigatonnes of CO2 since the Industrial Revolution, and the same WRI analysis puts the removal requirement at 7 to 9 billion tonnes per year globally by 2050. We separate the two terms properly in carbon removal versus carbon capture.
The delivery ledger for 2025
Total carbon removal today runs at 2.2 GtCO2 per year, equivalent to 5 percent of gross CO2 emissions, of which conventional land-based methods are 99.95 percent. Novel CDR, meaning everything the technology press writes about, is 0.05 percent of the total. It is growing at roughly 40 percent per year, comparable to solar's early curve, from a base small enough that the growth rate flatters it.
Inside that novel column, 2025 activity totalled 2.04 MtCO2, with biochar at 1.46 MtCO2 and BECCS at 0.51 MtCO2. Biomass direct storage added 0.05 MtCO2. Enhanced weathering contributed 0.0038 MtCO2 and mineral products 0.0022 MtCO2, which is to say roughly nothing. Biochar alone was close to three quarters of all novel carbon removal, and 67 percent of it came from woody biomass.
Now the number that matters commercially. Contracted volumes of novel CDR hit 30.2 MtCO2e in 2025, almost four times the 2024 figure, dominated by BECCS at 20.8 MtCO2e, while delivered and retired volumes were led by biochar. Biochar issuances went from 388,821 tCO2e in 2024 to 793,796 tCO2e in 2025. Most novel credits remain ex ante, meaning the removal has not happened yet.
The market data says the same thing from the other side. Since the start of 2022, 86 percent of all durable removal credits delivered and 92 percent of those retired have been biochar, while biochar accounts for only 10 percent of durable CDR contracted, against 75 percent for BECCS and 9 percent for direct air capture. The delivered-to-purchased ratio across the biochar market sits at about 1 to 4.5.
Contracted and delivered are ranking different technologies. Any evaluation that reads only the contract table gets the industry backwards.
The pathways, judged on deployability
Biochar and pyrolysis
Biomass is heated without oxygen until the carbon in it becomes a stable solid, which is then applied to soil or otherwise stored. Under registry accounting, net removals come to 60 to 92 percent of the gross CO2 captured in the biochar, with the range driven by decay assumptions and how much of the biomass lifecycle sits inside the boundary. Protocols apply durability adjustments over 100 or 200 years.
You will also see biochar quoted at 20 to 39 percent efficiency, from a peer-reviewed comparison of removal pathways on efficiency, timing and permanence. Both figures are correct. They measure different things: one is net credited removal against captured carbon, the other is removal efficiency at the point of soil integration across a wider system boundary. Treat anyone who quotes one to discredit the other as selling something.
BECCS
Burn biomass for energy, capture the CO2 from the flue gas, inject it into geology. The same peer-reviewed comparison finds BECCS delivers immediate and permanent removal, with efficiency significantly reduced where direct and indirect land-use change creates an initial carbon debt. It is the contract leader and a distant second on delivery, because each project is a large first-of-a-kind facility with a CO2 transport and storage chain attached.
Direct air capture
Fans pull ambient air across a sorbent, the CO2 is stripped out and stored underground or fixed into materials. The vendor case is fair: permanent, measurable, location-flexible and light on land, but energy-hungry and dependent on long-term policy support. It is the most rigorous pathway per tonne and, at 9 percent of contracts and a rounding error in delivered volume, still a technology in the process of proving itself rather than an option available at scale.
Enhanced weathering and mineral products
Crushed silicate rock spread on land, or CO2 mineralised into building materials. Both are chemically sound and both were measured in single-digit thousands of tonnes in 2025. Pre-commercial on the evidence, whatever the pipeline says.
Forests and soils
The 99.95 percent. Terrestrial ecosystems already remove around 30 percent of annual CO2 emissions, roughly 9.5 billion tons, with forests accounting for about 8.8 billion tons, at typically 100 year permanence and an average of 50 dollars or less per ton. The catch is reversal: fire, disease, deforestation or a change of land use puts the carbon back, and the measurement rests on estimates rather than meters.
What it costs and who is paying
Expected costs across methods run from under 10 dollars to over 1000 dollars per tonne, with most methods carrying upper limits above 200 dollars, well above current carbon prices. Cost dispersion within a single method is often as wide as the gap between methods, because system boundaries and co-product allocation differ.
The demand side is thinner than the technology coverage suggests. Microsoft is the all-time largest purchaser at nearly 50 million removal credits, with the next largest buyer, Meta, below 10 million; in the first half of 2025, 48 of the 89 entities purchasing CDR credits were first-time buyers, and nature-based credits traded at around 35 dollars.
Read those two paragraphs together and the investment question changes shape. This is not a market where a superior technology wins on merit at scale. It is a market with one anchor buyer, a widening pool of small ones, and a price ceiling set by what corporate procurement will tolerate. Delivery risk is priced into every forward contract, which is why the pathway that ships is worth more than the pathway that is theoretically cleaner.
Why the delivering pathway is the one that ships as hardware
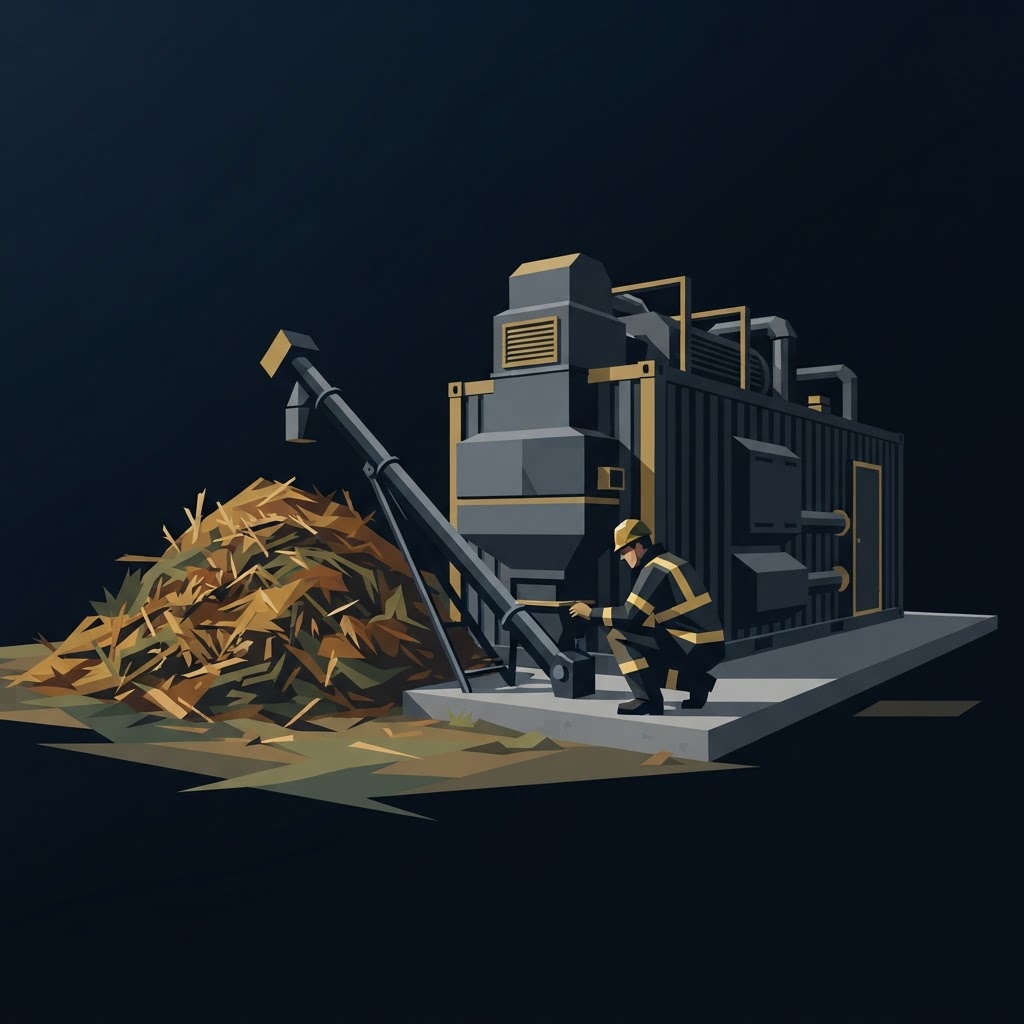
Biochar leads deliveries for an unglamorous reason. A pyrolysis unit is a manufactured product. It can be built in a factory, containerised, shipped, installed next to a feedstock supply and commissioned in months, and its output is a solid you can weigh. BECCS and DAC need bespoke plants, permitted CO2 transport and geological storage, each with its own timeline and counterparty.
The build data confirms it. Only about 20 percent of planned novel CDR capacity has actually been built in recent years, and existing projects plus those under construction would reach just 0.008 GtCO2 per year of capacity by 2030. Geography follows the equipment rather than the ambition: Europe hosts 48 percent of all novel CDR projects, including 86 biochar projects.
This is the part we can speak to from the deployment side rather than the commentary side. EX Venture finances, patents and deploys deep tech across four continents on a EUR 160M+ capital track record, and Zero-X has designed, financed and installed 200+ waste-to-energy units across 11 countries, with EX Carbon as the portfolio's biochar carbon removal venture and EX IX holding 24 patent families filed and roughly 100 more validated in the pipeline. The distance between a technology that works in a paper and one that runs in a market with unreliable grid power and an informal waste stream is not a scientific distance. It is a financing, patent and logistics distance, and it is the job description of a venture builder. The unit economics of that hardware are covered in the waste to energy business model, and the capital stack behind it in how waste to energy projects get funded.
How to evaluate a carbon removal project
Seven questions, in the order that kills deals fastest.
What is the durability claim and what decay model sits behind it? How hard is the measurement, and does it rely on a meter or a model? What is the supplier's own delivered-to-contracted ratio, not the industry's? Where does the feedstock come from, and would it have decayed or been burned anyway? What powers the process? What does a tonne cost against what buyers are actually paying, not against a target price? And is there protected IP, or is the process replicable by anyone who reads the permit application?
That last question is where most technical diligence stops too early. A removal process without defensible IP is a service business with a carbon story. Getting from a validated mechanism to a patented, financed, deployed asset is the same sequence for carbon removal as for any other hard technology, which is what a deep tech venture builder actually does.
FAQ
Which carbon removal technology is the cheapest? Nature-based removals, on paper, at an average of 50 dollars or less per ton and trading around 35 dollars in 2025. Durable engineered methods span from under 10 dollars to over 1000 dollars per tonne, and the cheapest number quoted for any method usually excludes something the buyer will eventually pay for.
Is direct air capture better than biochar? Better on durability and measurability, worse on cost and on tonnes actually delivered. DAC held 9 percent of durable contracts and a rounding error of delivered volume, while biochar supplied close to three quarters of novel removal activity in 2025. Serious buyers hold both, weighted by what they need the credits to prove.
Why do carbon removal projects sell credits before removing anything? Because most novel CDR credits are ex ante. The contract funds the capacity that will do the removal later. That is how contracted volumes reached 30.2 MtCO2e in 2025 while deliveries stayed in the hundreds of thousands of tonnes, and it is why forward purchase agreements carry delivery risk that spot credits do not.
Does carbon removal let companies avoid cutting emissions? No credible framework treats it that way. The scale arithmetic makes the point on its own: total removal today equals about 5 percent of gross CO2 emissions, and the projected 2050 requirement of 7 to 9 billion tonnes per year assumes deep emissions cuts alongside it, not instead of it.
How do I verify a supplier's removal claims? Check the registry, not the website. Look for issued and retired tonnes under a named methodology with a stated durability adjustment, then compare issuance history against contracted volume. A supplier with large contracts and thin issuances is selling capacity that does not exist yet, which may still be a reasonable investment as long as it is priced as one.